Eagle Rising Weather
SE Huntsville, AL PWS
Weather station
Weather
Climate
Astronomy
Meteorology
Tools
Diary
Regional
Info
Contact
Weather station
Live
Weather station
Current data
Live gauges
Live gauges
Gauges
Interactive views
Interactive graph
Interactive table
Interval summary
Reports
Reports
Trends
Trends
Statistics
Temperature
Feels like
Dew point
Humidity
Pressure
Wind speed
Wind gust
Precipitation
Solar radiation
Daytime
Nighttime
Rain seasons
Calendar
History
Degree days
Deviations
Growing degree days
Weather
Forecast
Outlook
Forecast model
Forecast model
Wx radio
New
Current conditions
Global map
Metar
World weather
Extremes
Week days
Radar
Gr level3
Grlevelx
Satellite images
Radar
Climate
Climate map
Station climate
Seasons
Continentality
Climate
Climate
Climate of countries
Country information
Geographical calculations
Noaa report
Weather records
Yearly averages
Astronomy
Moon phase
Astronomical calendar
Sunrise / sunset
Maximum potential solar radiation
Solstice / equinox
Sun/moon data
Day / night
Night sky
Meteorology
Weather symbols
Scales
History
Climate classification
Weather terminology
Tools
Air traffic
Marine
Weather display parser
User map
Api
Calendar
Diary
Station diary
Regional
Drought
River heights
Influenza
Snow data
Pollen calendar
Pollen forecast
Info
About
Huntsville
Eagle rising weather
Davis vantage pro2
Links
Social networks
Station data feed
Contact
Stickers
Huntsville, al sticker
Point of contact
Contact
Guestbook
Blog
Blog
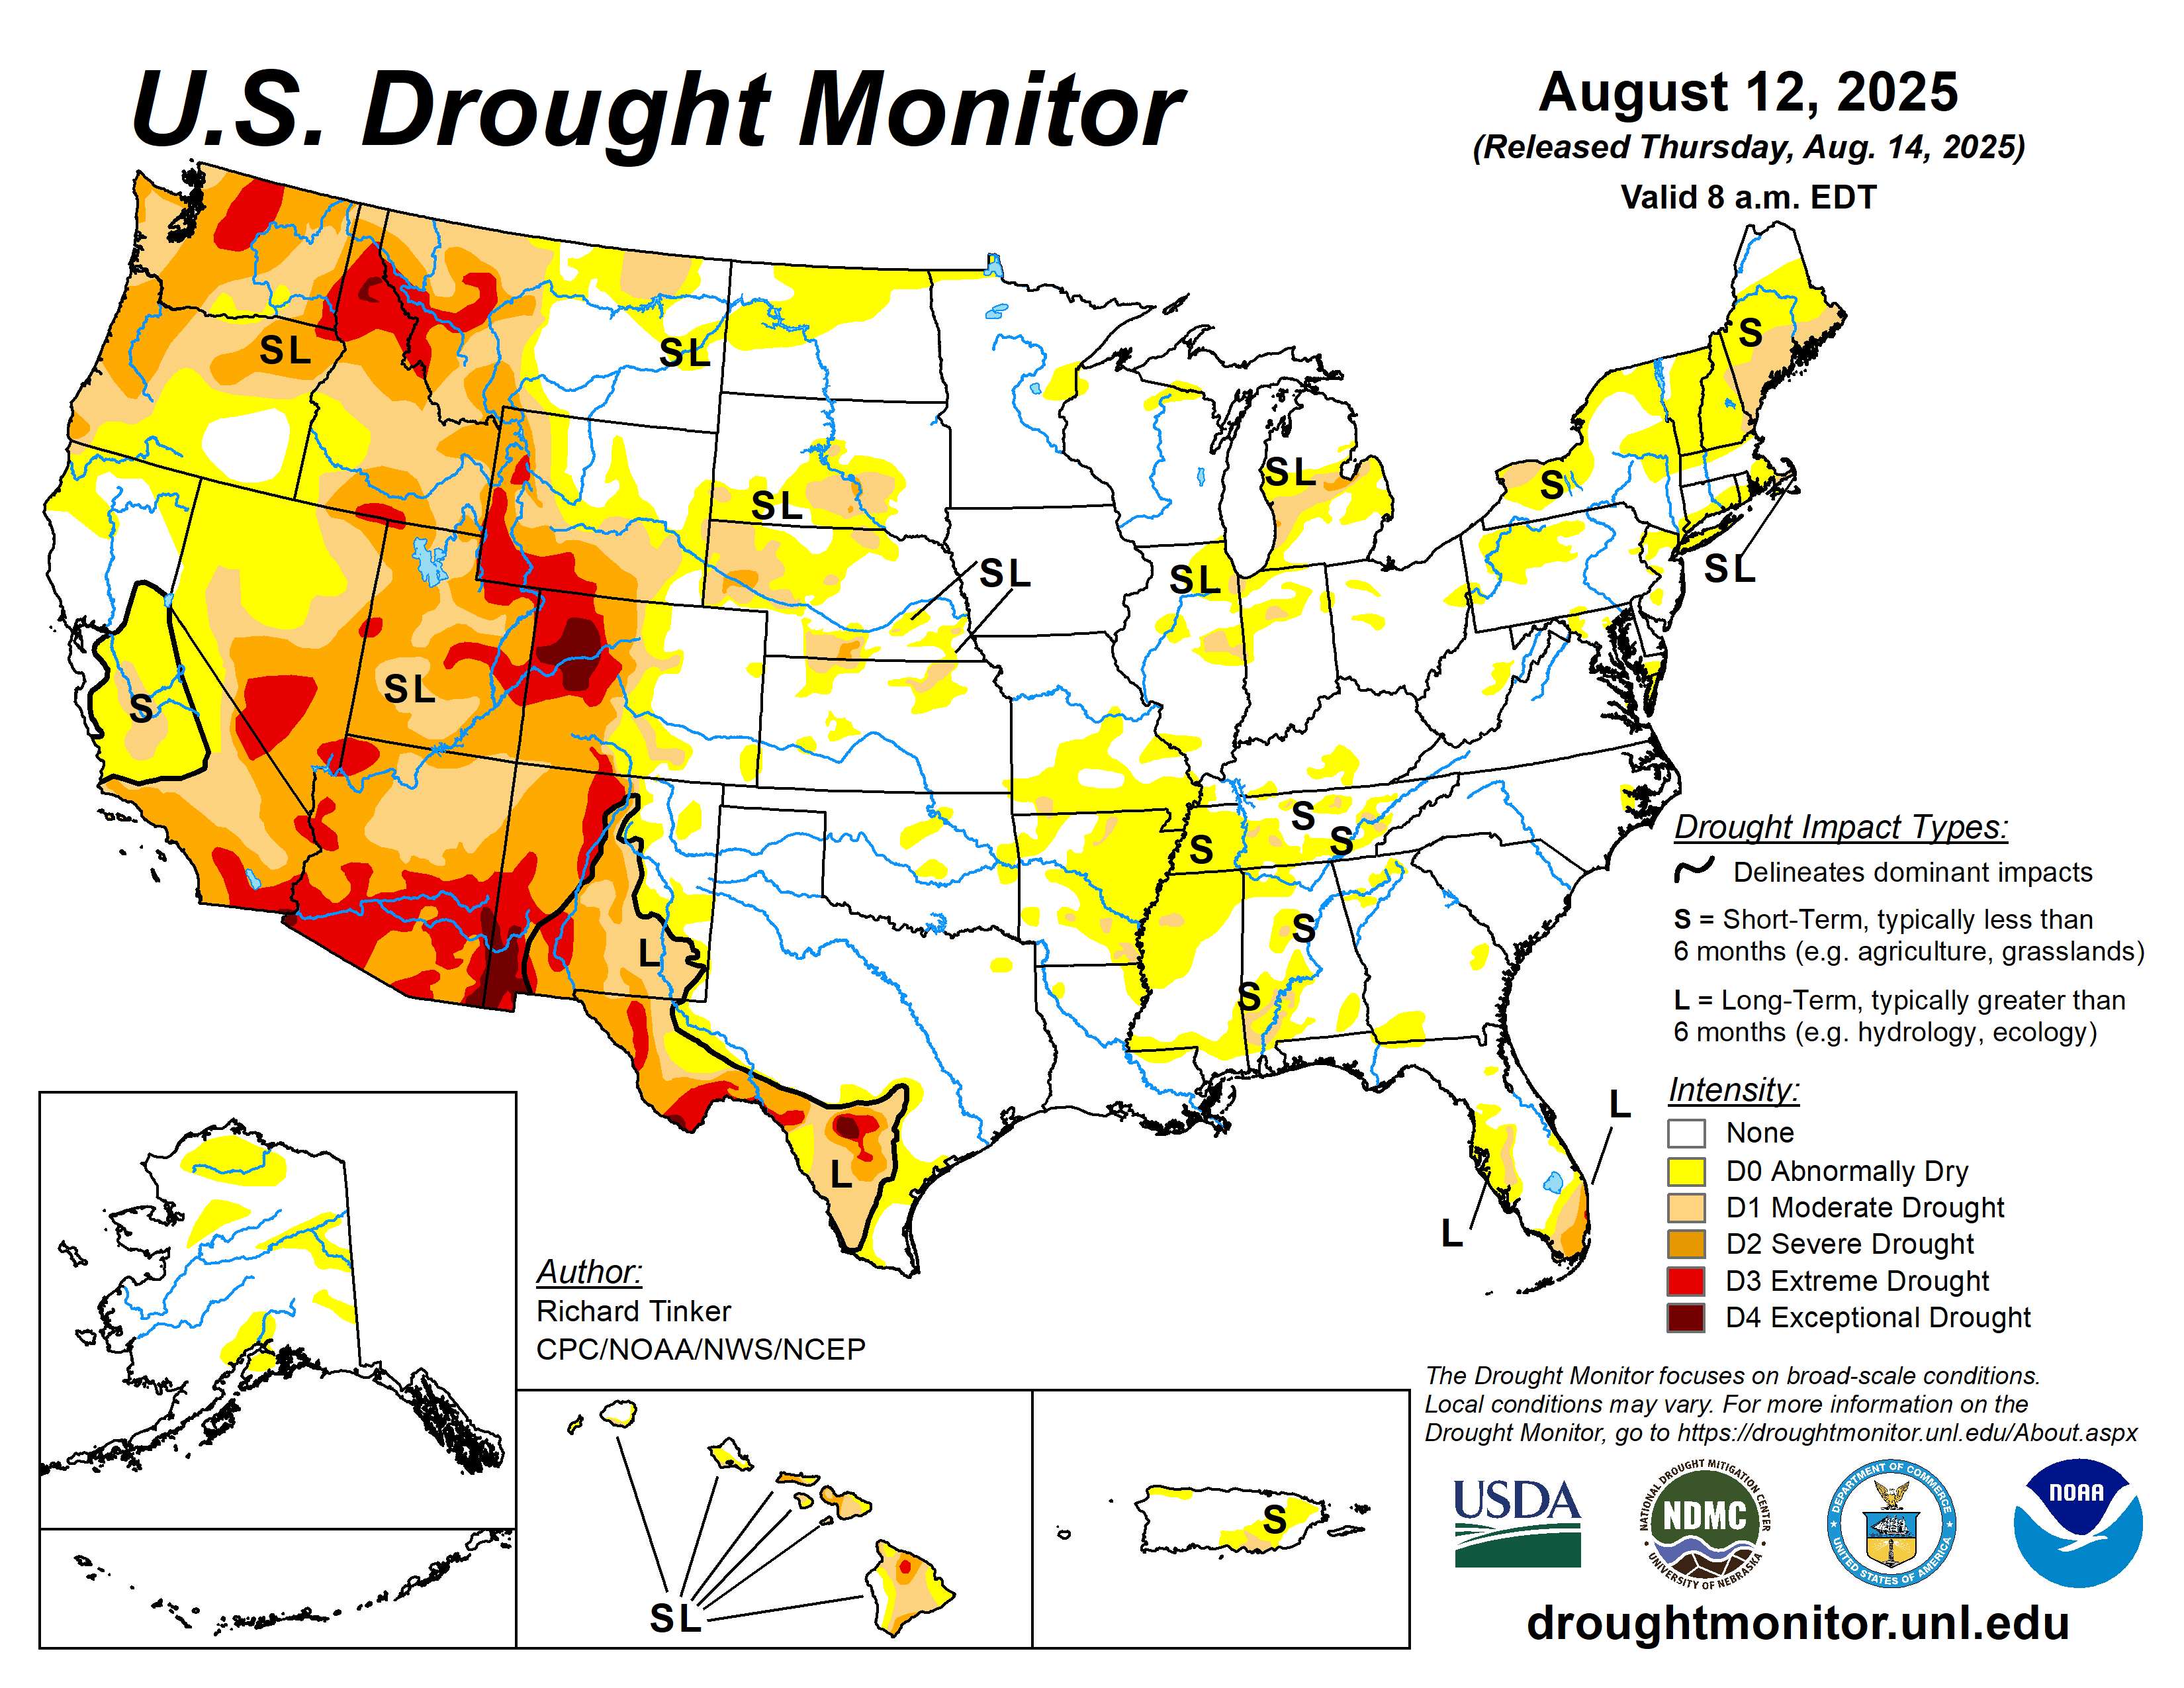
Drought
Current Conditions
Seasonal Drought Outlook
Monthly Drought Outlook
Crop Moisture Index
Soil Moisture - Total Daily
Soil Moisture - Total Monthly
Soil Moisture - Anomaly Daily
Soil Moisture - Anomaly Monthly
Soil Moisture - Percentile Daily
Soil Moisture - Percentile Monthly
Soil Moisture - Change Monthly
Soil Moisture - Change Seasonal
Soil Moisture - Predicted Anomaly Change This Week
Soil Moisture - Predicted Anomaly Change Next Week
Groundwater Drought Indicator
Root Zone Soil Moisture Percentile
Surface Soil Moisture Percentile
Evapotranspiration and Drought - Current 2 Week
Evapotranspiration and Drought - Current 4 Week
Evapotranspiration and Drought - Current 8 Week
Evapotranspiration and Drought - Current 12 Week
Significant Wildland Fire Potential Outlook - This month
Significant Wildland Fire Potential Outlook - Next month
Significant Wildland Fire Potential Outlook - Long-term
Source: NOAA
Colorado
Kansas
North Dakota
Nebraska
South Dakota
Wyoming
Iowa
Illinois
Indiana
Kentucky
Michigan
Minnesota
Missouri
Ohio
Wisoncsin
Connecticut
Delaware
Massachusetts
Maryland
Maine
New Hampshire
New Jersey
New York
Pennsylvania
Rhode Island
Vermont
West Virginia
Arkansas
Louisiana
Mississippi
Oklahoma
Tennessee
Texas
Alabama
Georgia
Florida
North Carolina
South Carolina
Virginia
Alaska
Arizona
California
Hawaii
Idaho
Montana
New Mexico
Nevada
Oregon
Utah
Washington
Data source: NOAA
Drought (D1-D4) is impacting
%
million
of the US and % of the lower 48 states.
people in the U.S. and in the lower 48 states.
Design
Design selection...
Units
C
F
km/h
m/s
mph
kt
mm
in
hPa
mmHg
inHg
m
ft
m
km
mi
Language
Icons
Temperature
Humidity
Pressure
Wind speed
Wind gust
Precipitation
Solar radiation
Snow
Feels like
Dew point
UV
Visibility
Cloud base
Evapotranspiration
Indoor temperature
Indoor humidity
Sunrise
Sunset
Moon rise
Moon set
Time
Menu
From
To
Fullscreen
Export as image
Settings
Homepage
Webcam
Table
Graph
Map
Steady
Rising
Falling
Warning
Latitude
Longitude
History
Solar eclipse
Lunar eclipse
GPS
Elevation
Day
Month
Year
High temperature
Low temperature
Day
Night
Spring
Summer
Fall
Winter


")

")
")

")
")

")
")
")

")

")


")
")
")
")


")

")